April
Contact
Wayne Miller
CPED
Email: wmiller@uada.edu
Kristin Higgins
Public Policy Center
Email: khiggins@uada.edu
University of Arkansas System Division of Agriculture
Cooperative Extension Service
2301 S. University Avenue
Little Rock, AR 72204
Arkansas Population Tops 3 Million But Population Growth Slowest Since the 1980s
Arkansas’ population grew by 95,000 people over the past decade - officially topping 3 million people for the first time. Yet only in three decades since 1900 has Arkansas’ population growth been slower than from 2010 to 2020.
The 3.3% growth announced by the U.S. Census Bureau on April 26 kept Arkansas at the same level in terms of how many representatives the state will have in the U.S. House of Representatives. Arkansas was one of 37 states that did not lose or gain a congressional seat in the apportionment process that divvies up the 435 U.S. House of Representatives based on state population.
Overall, the once-a-decade population count determined there were 331,449,281 people in the United States as of April 1, 2020. Census officials said the number of Census respondents represented a 7.4% growth in population since 2000, the second slowest growth rate in U.S. history.
Nearly the same thing could be said for Arkansas, where official 2020 Census data showed a smaller population than the 2019 Census estimates.
Only in three decades since 1900 has Arkansas’ population growth been slower than from 2010 to 2020. According to the U.S. Census Bureau, Arkansas’ population as counted by the 2020 Census was 3,011,524, which suggests a growth of approximately 3.3% from the 2010 Population Census. This was the slowest growth since the decade from 1980 to 1990, when Arkansas’ population grew 2.8%.
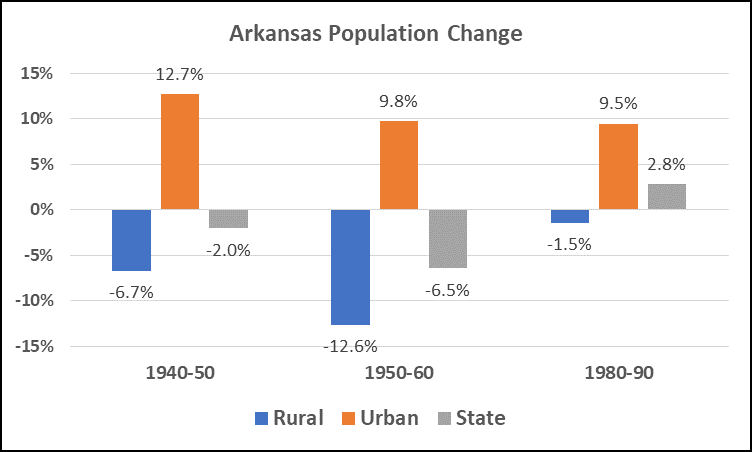
There were two prior decades when Arkansas’ population declined. Arkansas experienced a 2% decline in population from 1940 to 1950 and a 6.5% decline from 1950 to 1960. During both decades there was a large rural to urban migration and a large outmigration from the state during the 1950’s. This outmigration from the state was in part due to the attraction of jobs in northern states.
Figure 1. Arkansas Population Change - Rural Versus Urban - Between 1940-1990

Rural areas of the state were most affected by the outmigration and population decline
during the two decades from 1940 to 1960. During the 1940s the population of rural
counties[1] declined 6.5% while the population in urban counties increased nearly 13%. Similarly,
population declined nearly 13% in rural counties and increased approximately 10% in
urban counties during the 1950s.
Population trends have shown that eastern Arkansas has lost population, but official
Census data for cities and block-by-block comparisons won’t be available until August
in raw data and by the end of September in a format that most people can use.
State, county and city officials rely on the population data to realign political districts. Quorum Court, city council and legislative districts often shift after the Census to account for population growth or loss. Districts are supposed to have roughly the same population to provide equal representation.
In an Arkansas Democrat-Gazette article, Secretary of State Spokesman Kevin Niehaus said they know that Arkansas House members will represent an average of 30,317 people and senators will represent 86,107 people, give or take.
Learn more about redistricting basics in Arkansas at uaex.uada.edu/redistricting.
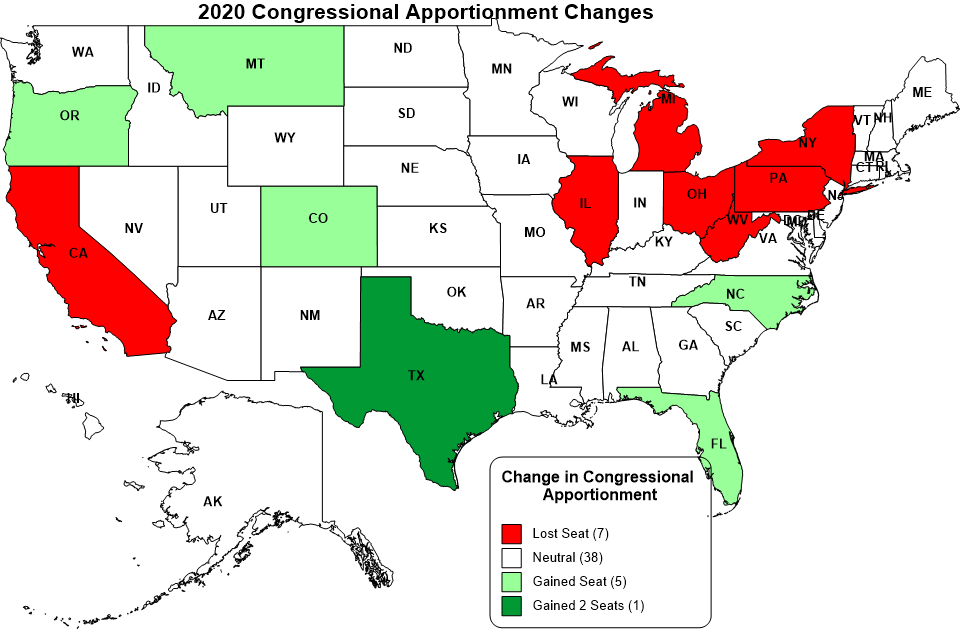
Figure 2. U.S. Apportionment Gains/Losses By State

The map above (Figure 2) shows the six states that gained seats in the U.S. House
of Representatives (green), seven states that lost seats (red), and 37 states stayed
the same (white). U.S. Census officials said Monday that New York lost a seat based
on being short 89 people. If 89 more people had been counted in their population,
they would have kept that lost seat. Note: Washington D.C. is included in the map's
key of 38 locations with no gain/loss. The 689,545 people living in the District of
Columbia are included in the U.S. Census total for the United States but the district
does not have any of the 435 voting seats in Congress.
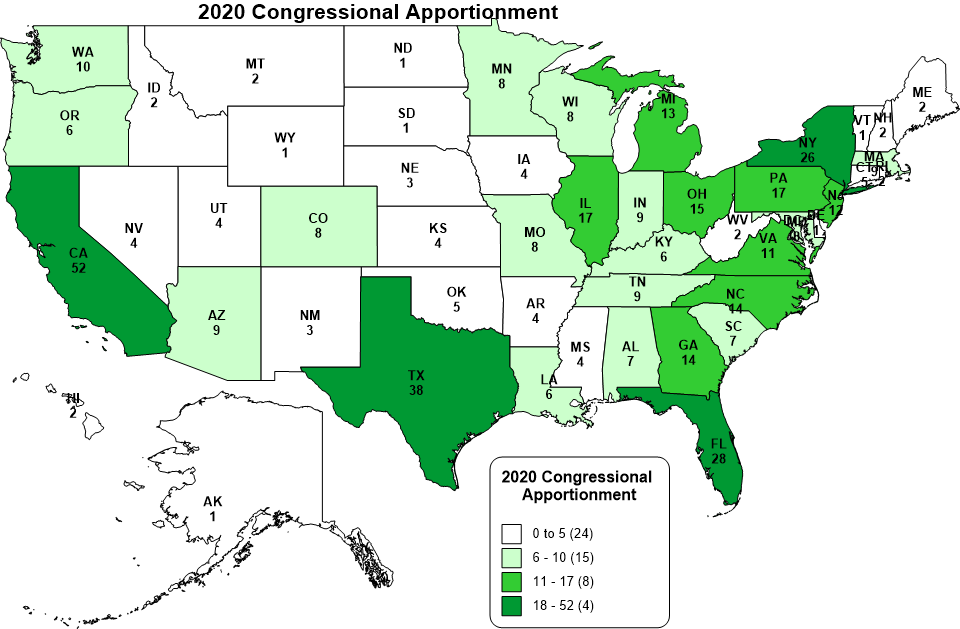
Figure 3. U.S. House of Representative Seats By State Following 2020 Apportionment

The map above (Figure 3) shows the number U.S. House of Representatives by state, or apportionment as it's called. Arkansas continues to have four of the 435 seats. California, with 39.5 million people, has the most representatives with 52 seats and Wyoming, the smallest state by population with 576,851 people, has one seat in Congress. Note: Washington D.C. is included in the map's key. The 689,545 people living in the District of Columbia are included in the U.S. Census total for the United States but the district does not have any of the 435 voting seats in Congress.
[1] For a definition of rural and urban counties, see the 2021 Rural Profile of Arkansas at https://uaex.uada.edu/ruralprofile