Utility Rates Determine the Value of Solar Production
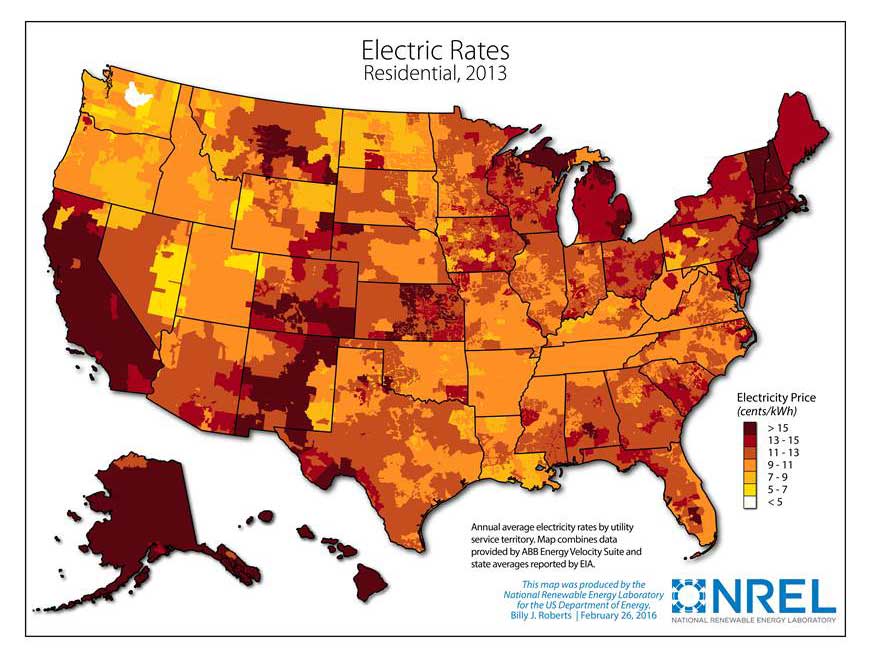
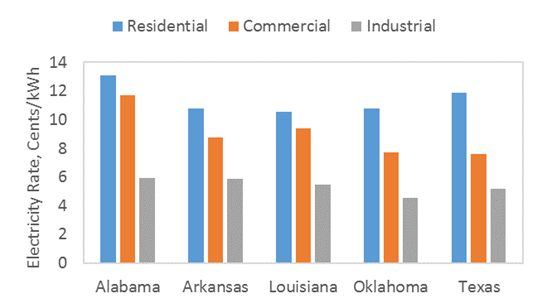
Arkansas enjoys one of the lowest electricity rates across the nation (figure 1), together with other states in the Southwest Central region (figure 2). The caveat is the higher utility rates, the greater the value of PV-produced electrons. It is important to understand what your business is billed regarding fixed charges, consumption and demand charges before making a decision on a solar project.

Figure 1. Residential Electric Rates, 2013

Figure 2. Average electricity rates of the states in the Southwest Central region (October 2020)
Understand Demand Charge
Making Sense of your Electric Utiliy Bills with Demand Charges Factsheet
Most commercial and industrial customers have utility bills that are divided into two major categories:
- Energy consumption: the amount of energy (kWh) consumed, multiplied by the relevant
price of energy ($/kWh) during the billing period.
- Demand: the maximum amount of power (kW) drawn for any given time interval (typically 15 minutes) during the billing period, multiplied by the relevant demand charge ($/kW).
Demand charges, which account for peak electricity use during the month, are needed because it is expensive for the utility to build and maintain the ability to serve their territory’s highest demand during a monthly basis, even though that peak demand may only occur once. Unfortunately, the electricity generated by a PV system will offset the energy consumption (kWh) portion of the bills, but not necessarily the demand portion of the bills, due to the demand reduction may not be consistent due to weather (for example, peak demand occurs during a cloudy day).
Utilities have different types of rate structures for different type of customers. While the exact billing approach varies by utility, some rate structures include multiple types of demand charges, with higher charges during hours of peak demand, and lower charges during “partial-peak” or “off-peak” hours (Time-of-Use rates). For customers whose utility rates include them, demand charges can contribute 30 to 50% of the monthly electric bills.
Residential customers don’t have demand charge. A small percentage of Arkansas broiler farms have demand charges. Electricity on broiler farms is generally consumed by ventilation fans, lights and other small motors for feed and water delivery. The peak demand is usually around 10-20 kW per house in the summer when all fans are in use for cooling. On the other hand, row crop farms may have 20 kW demand from each fan on grain bins, or 100 kW demand from an irrigation pump.
For customers who pay demand charge, a battery can be installed to go along with the solar system to store electricity and reduce peak demand. To understand the cost and value barriers of the energy storage technologies installed in conjunction with residential PV system, check out this NREL article.
As a rough estimate, the benchmarked price of small-battery case, which uses a 5.6-kW PV array and a 3-kW/6-kWh lithium-ion battery system, is about twice as high as the price of a standalone 5.6-kW PV system.
On the utility-scale solar projects, energy storage is a critical component in managing demand loads and deliver power at the right time. This is why the recent utility-scale solar projects are mostly accompanied by energy storage.